The screenshot-first trading journal
with an AI coach on your own GPU
One keystroke saves the chart while the trade is still live. Tag it after the close, import your broker fills, and let ChartLog show you exactly where your edge is and where it leaks.
Included with BullBearz · Windows 10/11 · No cloud, no telemetry. Optional local AI runs on your GPU.
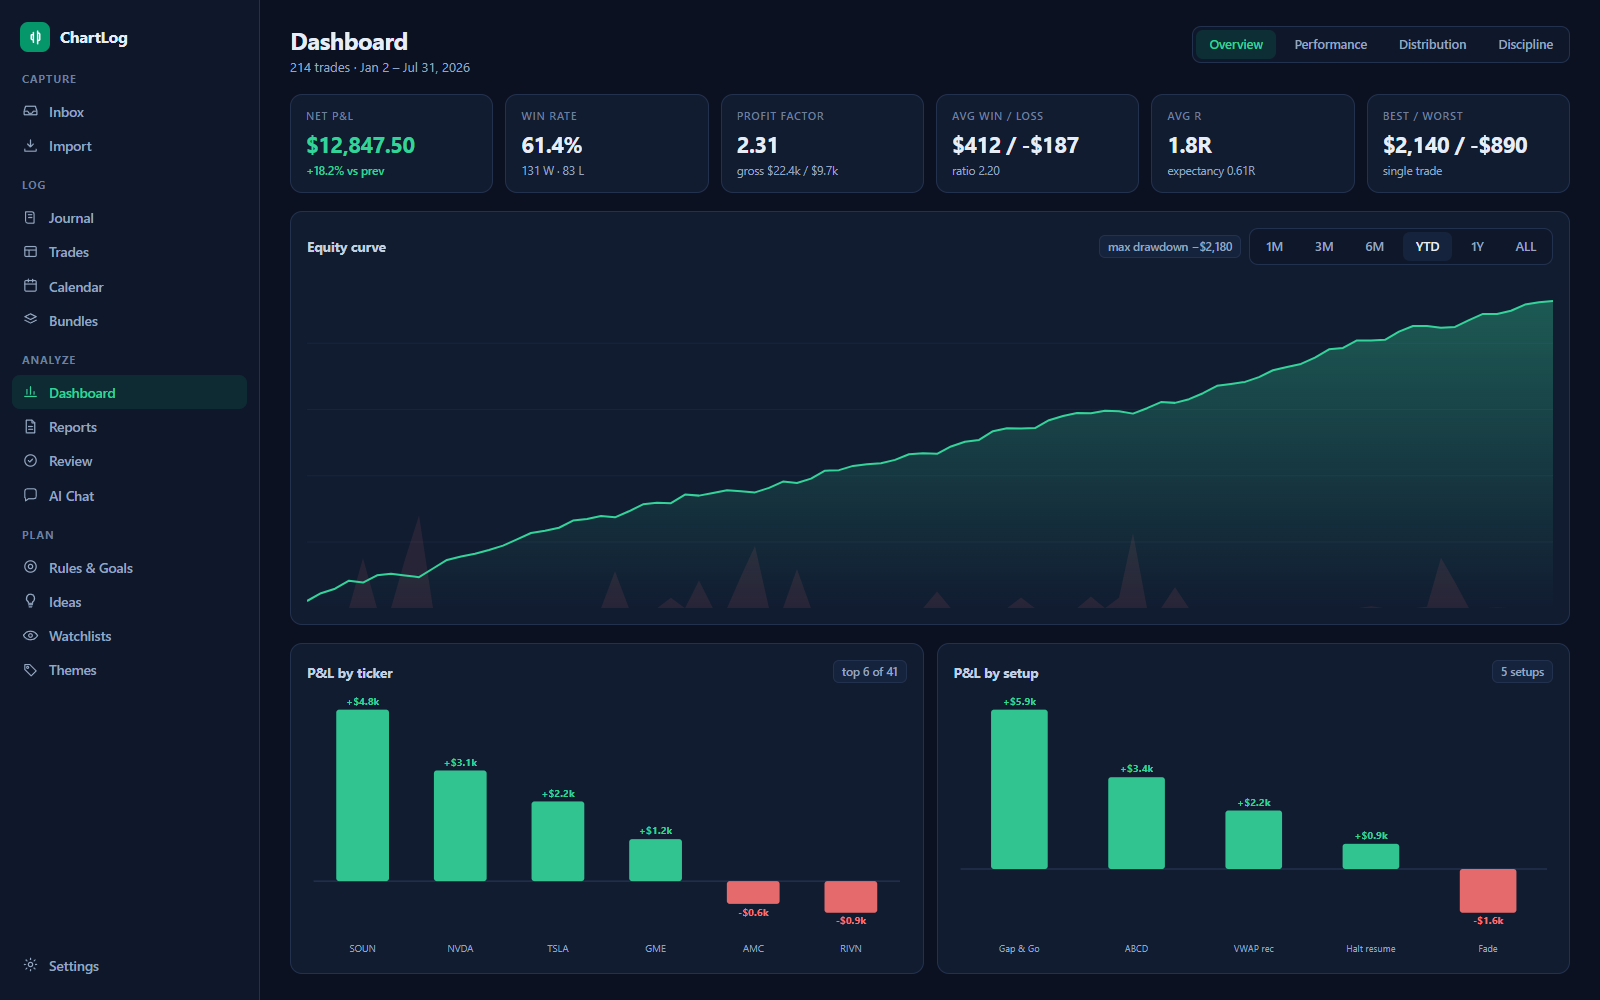
Save the chart in one keystroke.
Tag it later.
Mid-trade is no time for paperwork. ChartLog gets the screenshot out of your way instantly, and everything lands in an Inbox you sort when the market closes.
- Global hotkey. Press Ctrl+Alt+J anywhere, even inside DAS Trader, and the clipboard chart is saved silently.
- Paste, drag & drop, or watch a folder. Ctrl+V into the app, drop image files from Explorer, or point ChartLog at a folder it auto-imports from.
- Auto ticker detection. ChartLog reads the ticker from your trading platform's window title and pre-tags the capture.
- One-click promote. Turn inbox screenshots into a trade, or into a multi-timeframe bundle by dragging them onto each other.
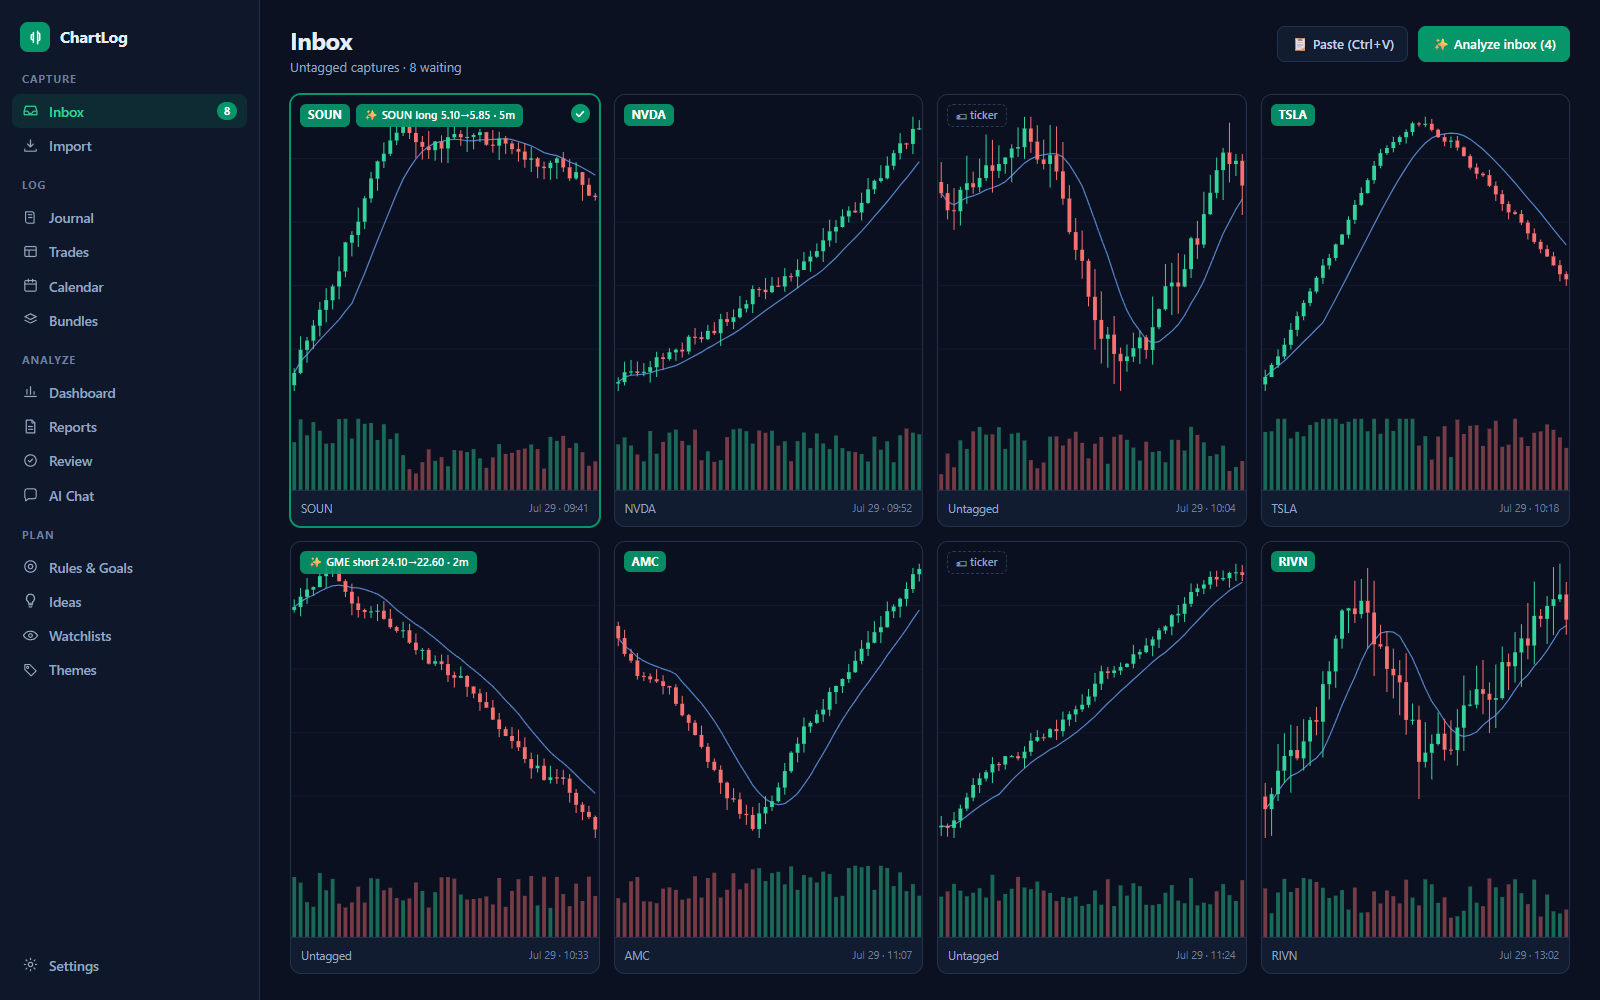
A journal that looks like your trading, not a spreadsheet
Every trade carries its screenshots, P&L, R-multiple, setup, tags, mistakes and notes. Browse by day, week or month, and filter by anything.
- Trade cards grouped by day with daily P&L totals, cover chart, and momentum context (float, market cap, % gain, cycle, country).
- Spreadsheet view. A sortable, inline-editable table with bulk actions, column presets, pagination and one-click CSV export.
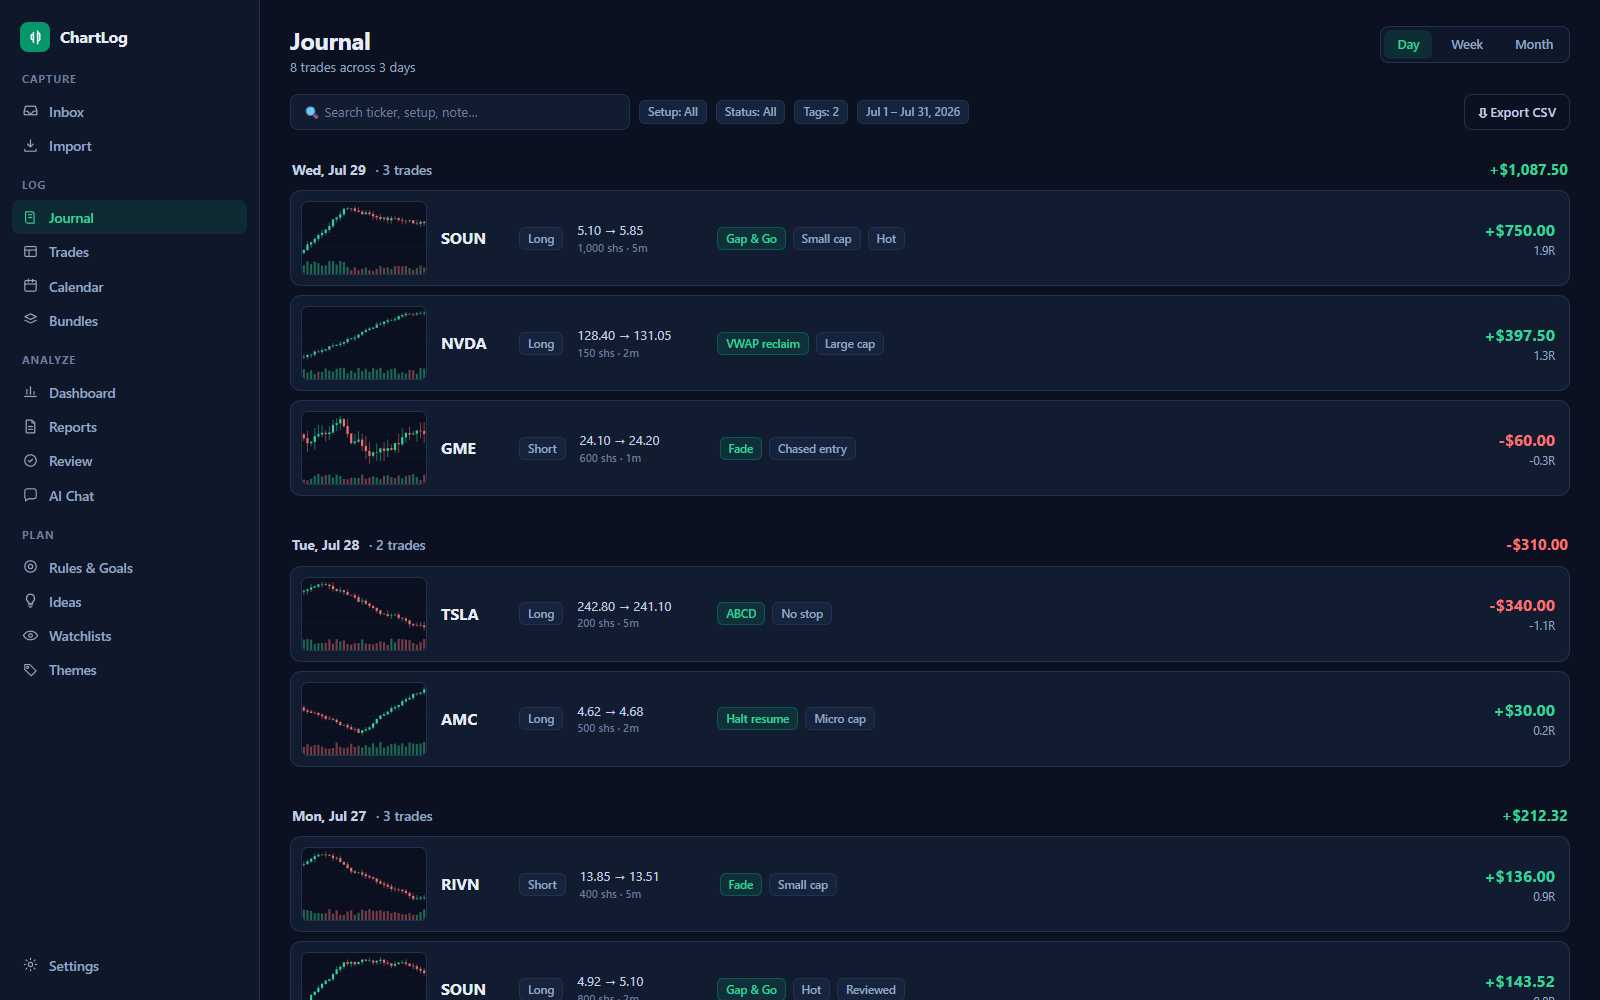
- P&L calendar. A month heatmap colored by profit intensity, with monthly stats and goal-hit dots on winning-process days.
- Bundles, Ideas, Watchlists & Themes. Stack multi-timeframe charts, track theses on tickers you didn't trade, and plan tomorrow.
- Full-screen lightbox with keyboard navigation, timeframe tags (1m to Weekly) and a filmstrip slider.
Your broker's CSV, imported right
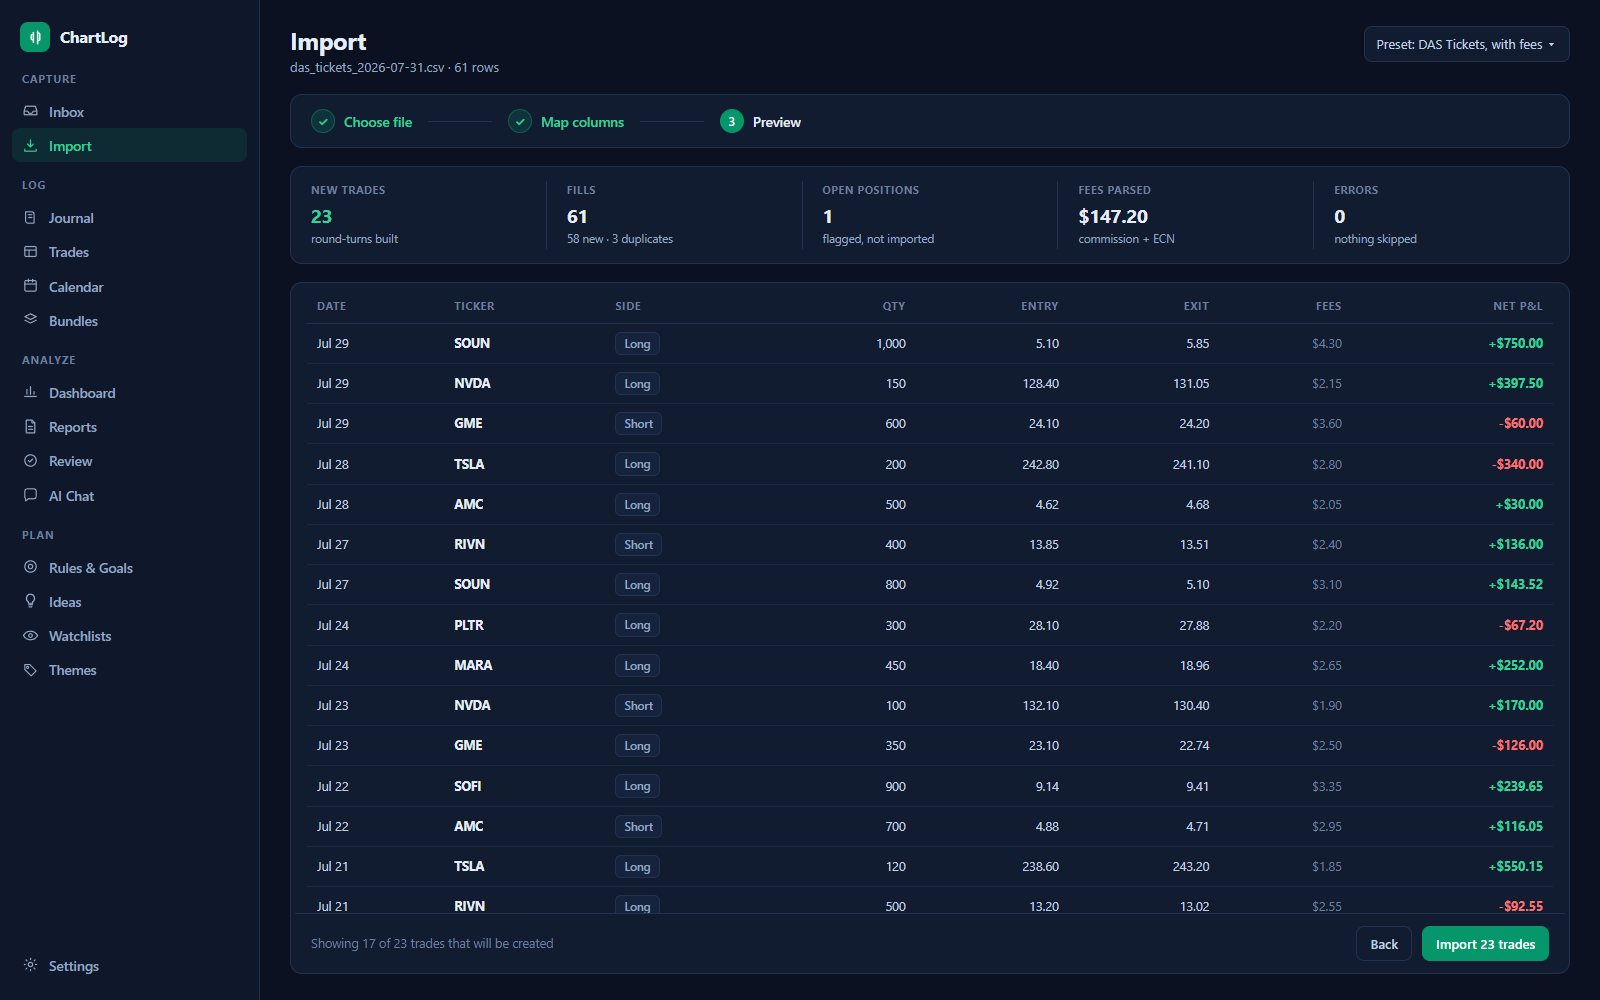
A three-step wizard turns raw fills into clean round-turn trades, scale-ins, flips and partial exits included. Re-import the same file and nothing duplicates.
- DAS Trader fills. Built-in preset. Multi-fill orders are aggregated with average-cost P&L per round-turn.
- DAS Tickets with fees. Commissions and ECN/route fees import straight onto each trade.
- Tradervue & closed-trade exports. One-row-per-trade files are detected automatically.
- Custom column mapping. Map any CSV once, then save it as a preset. Preview exactly what will be created before committing.
- Honest edge cases. Open positions are flagged, never mangled, and duplicate fills are skipped by hash.
Find the edge. Name the leak.
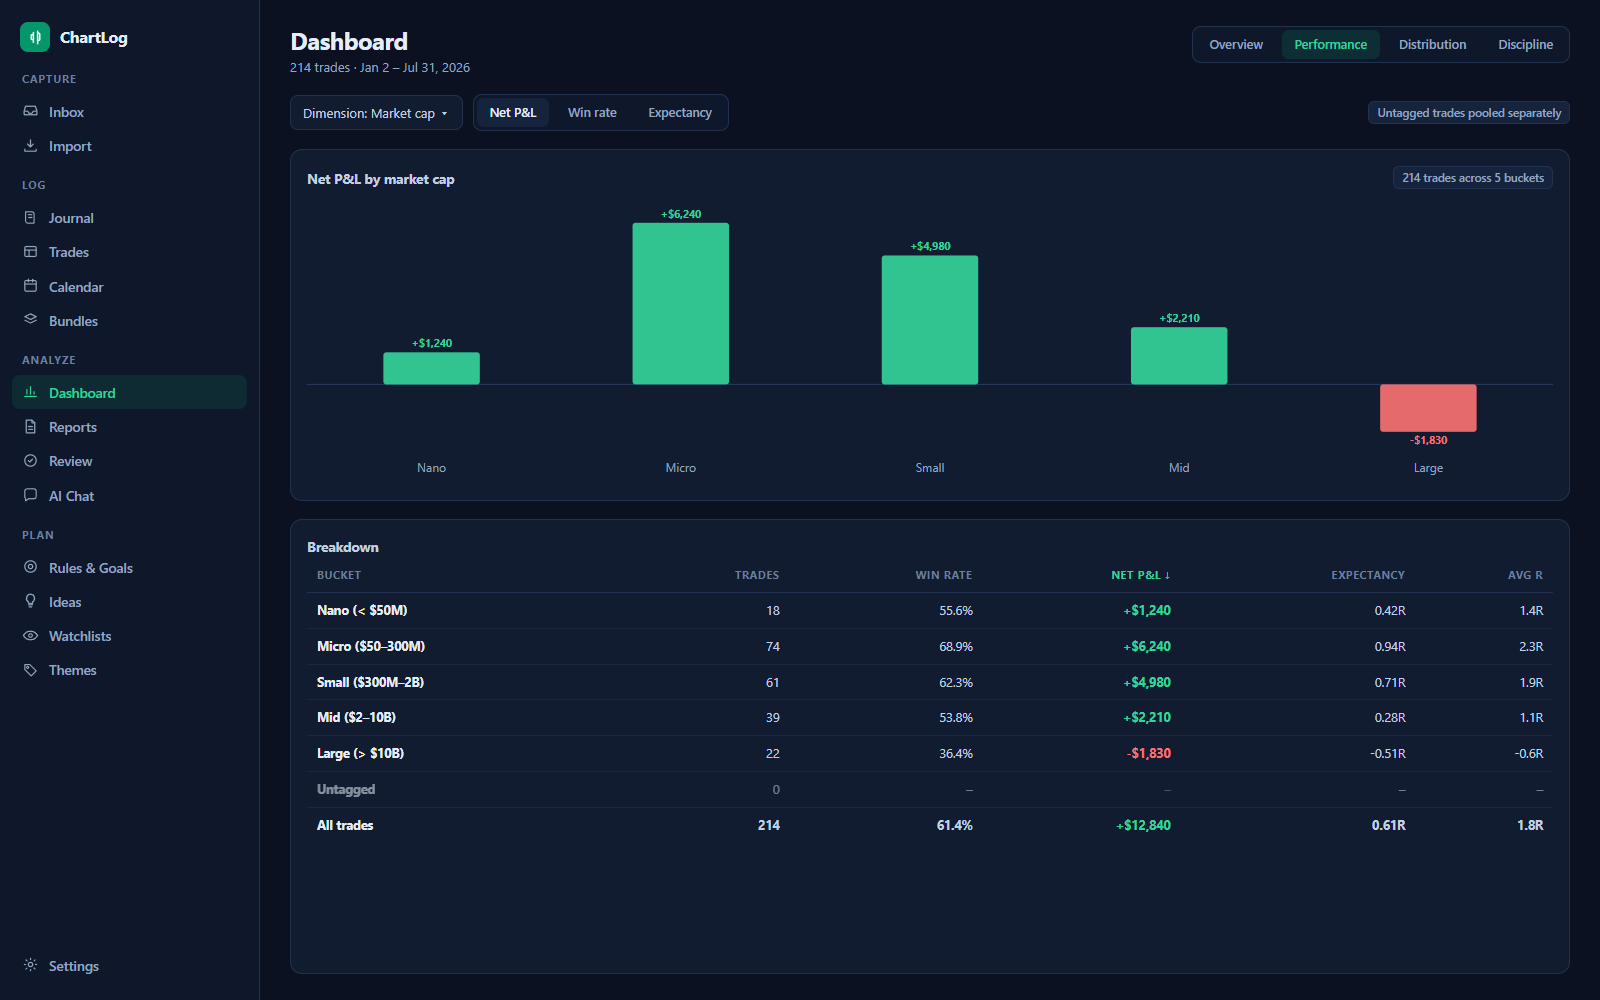
Every number is computed from your actual trades, after costs. Slice performance by the dimensions that matter to momentum traders, not just win rate.
📊 Dashboard
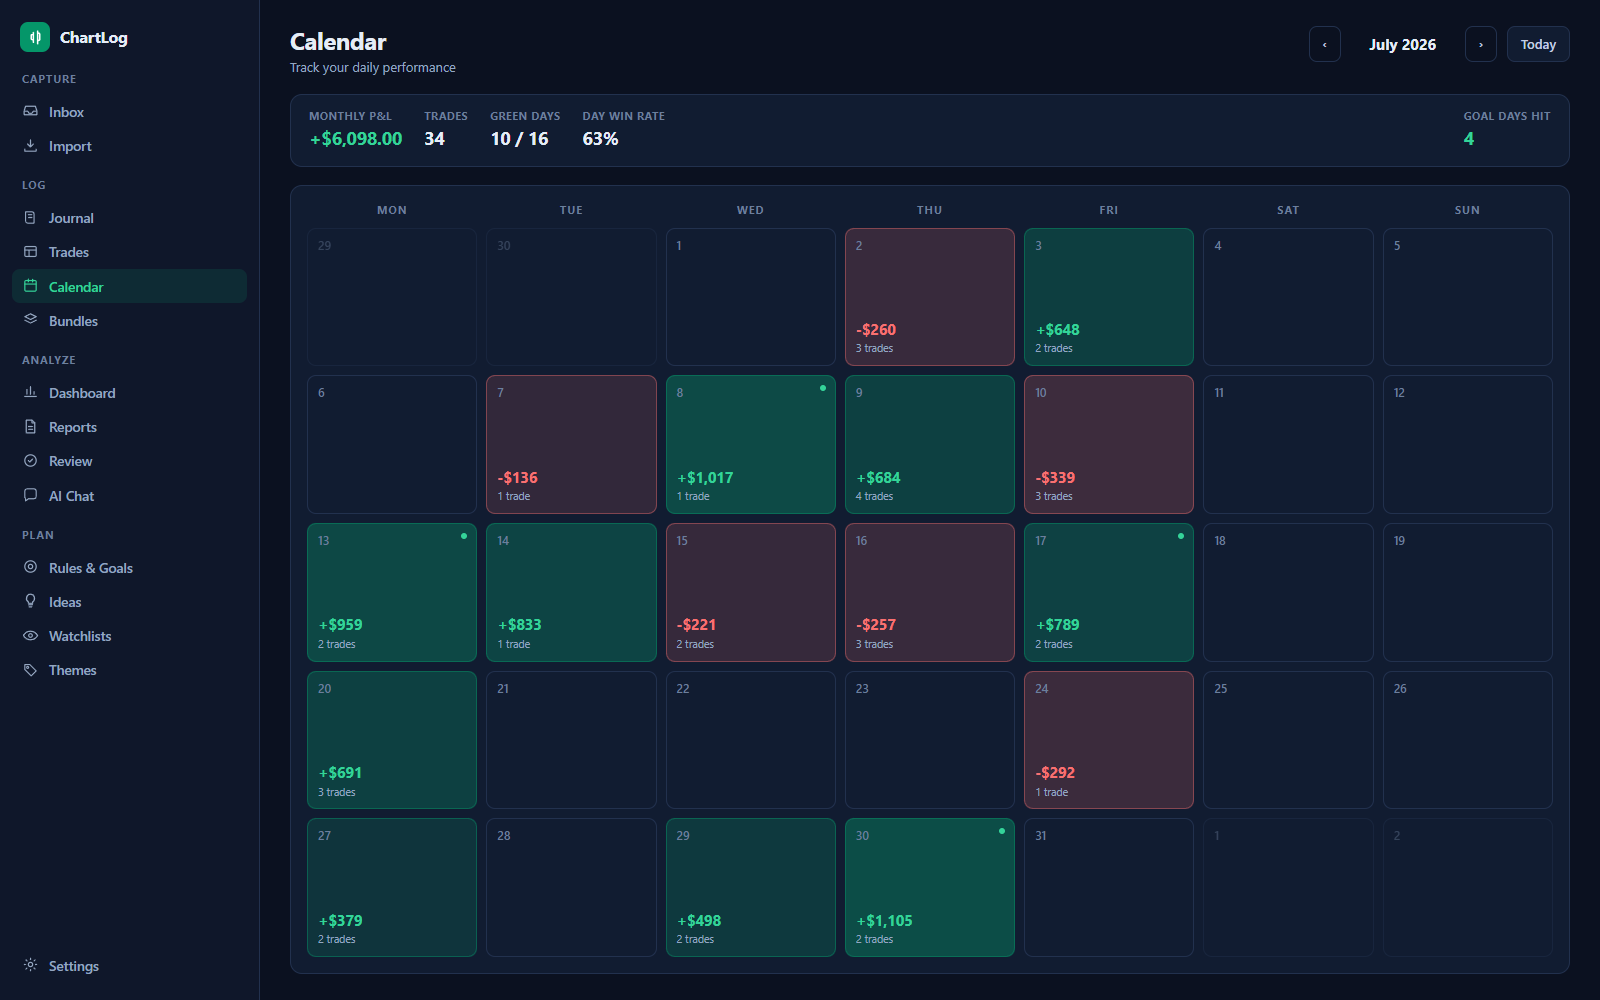
Net P&L, win rate, profit factor, expectancy, avg R and period-over-period deltas. Equity curve with drawdown overlay, P&L by ticker and by setup, goal tiles and AI insight cards.
📑 Reports
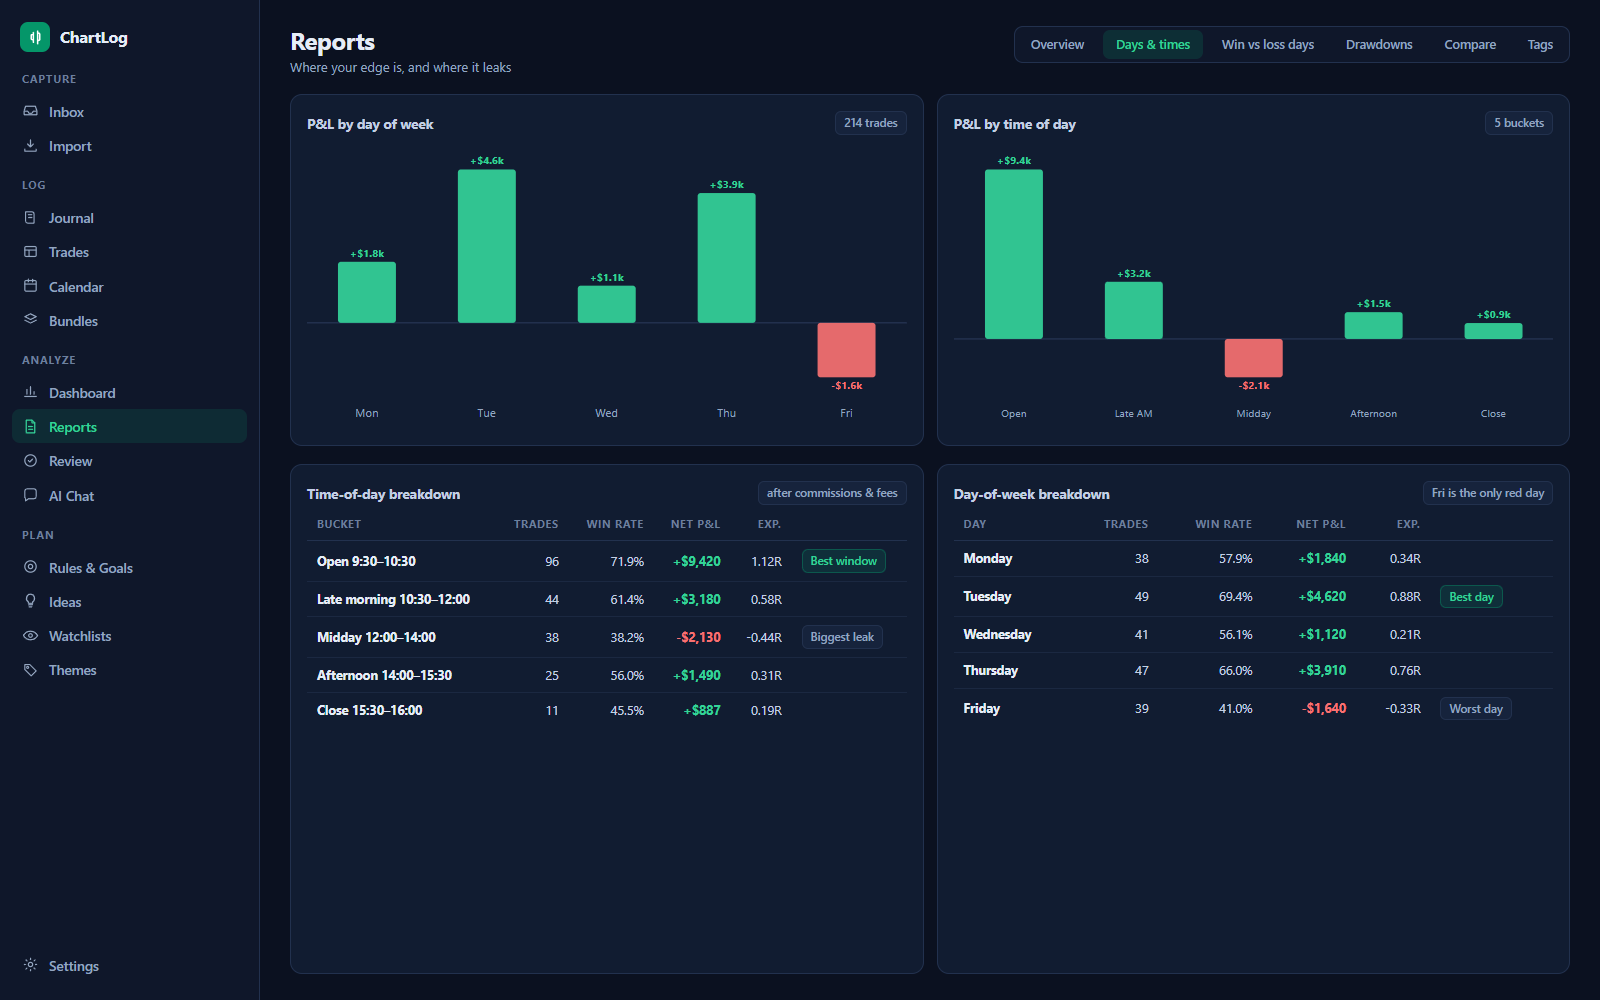
The deep-analysis surface: overview, day & time breakdowns, win-vs-loss day anatomy, drawdown analysis, side-by-side comparisons and tag breakdowns, and every report is linkable.
8 edge dimensions
Bucket P&L, win rate and expectancy by cycle, market cap, float, % gain, country, side, day of week and time of day. Field-less trades pool honestly into "Untagged".
Risk & distribution
R-multiple and P&L histograms, underwater (drawdown) curve with max-drawdown callout, win/loss streaks and best/worst days.
True cost tracking
Commissions, ECN/route fees and short-locate fees subtract into a real net P&L. A "cost of doing business" card shows gross → net and where the money goes.
An AI coach that runs on your GPU
ChartLog ships a built-in local runtime (llama.cpp) with a guided setup wizard. Download a vision model once and every AI feature works fully offline. Already run LM Studio or Ollama? ChartLog auto-detects them. Prefer a cloud model? Bring your own API key. Your choice, per feature.
✨ Vision extraction
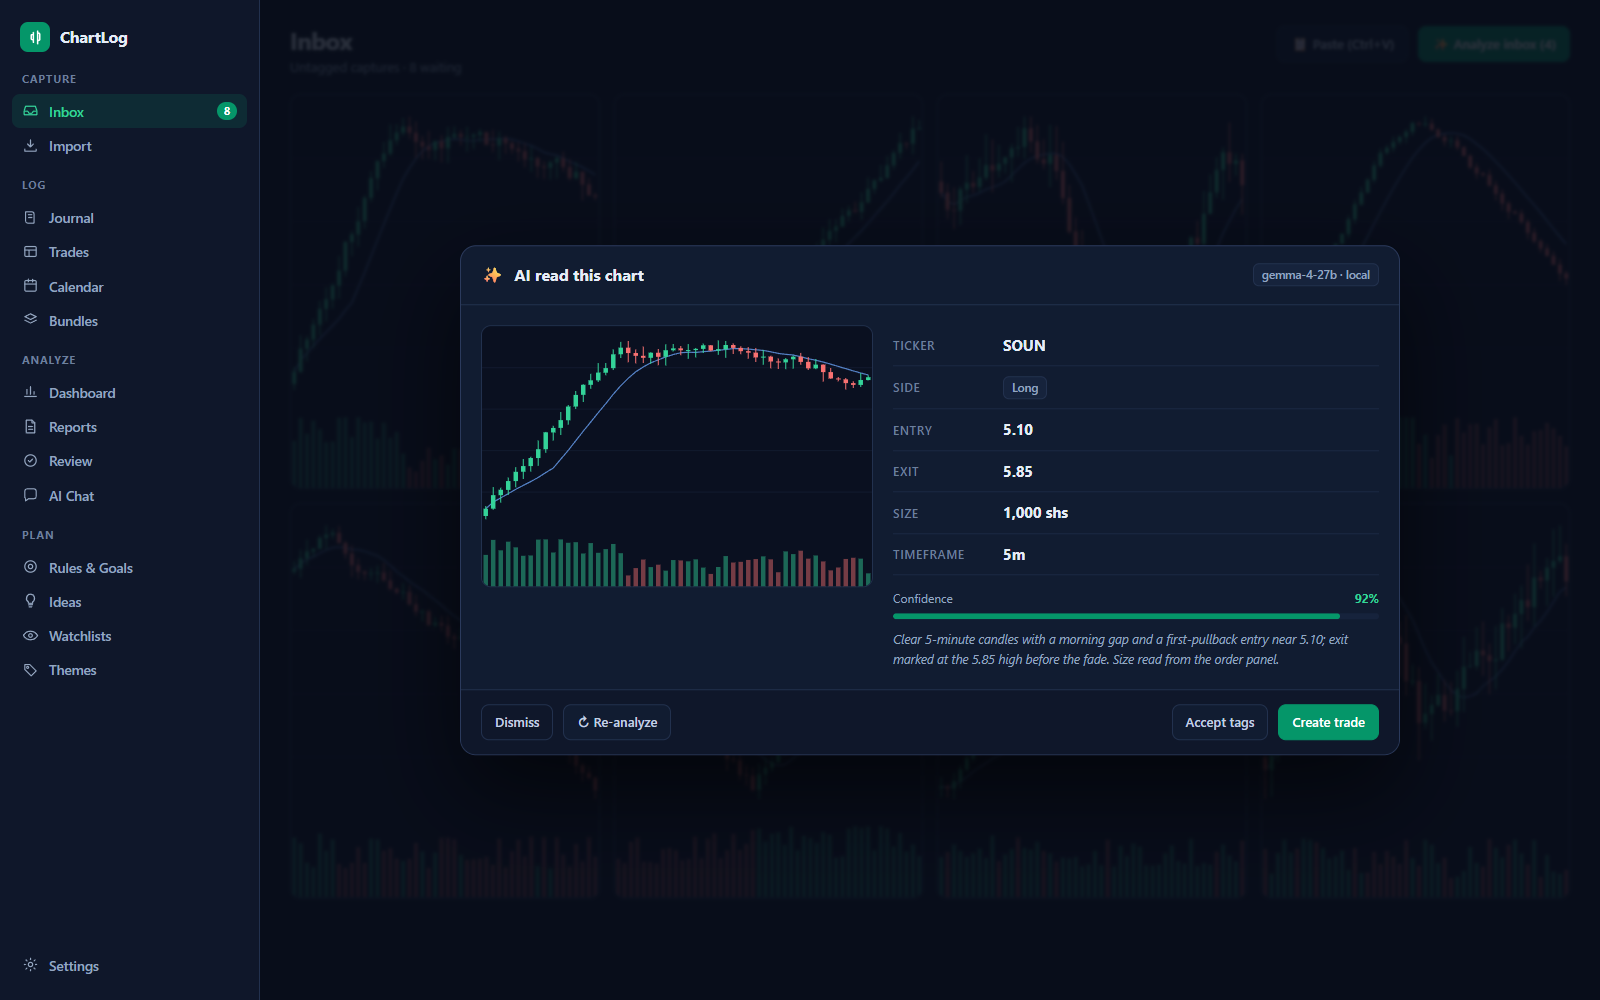
The model reads ticker, side, entry, exit, size and timeframe off each screenshot into a review-gated suggestion. Accept the tags or create a pre-filled draft trade in one click. The AI suggests, you confirm. It never auto-commits.
💬 Chat with your journal
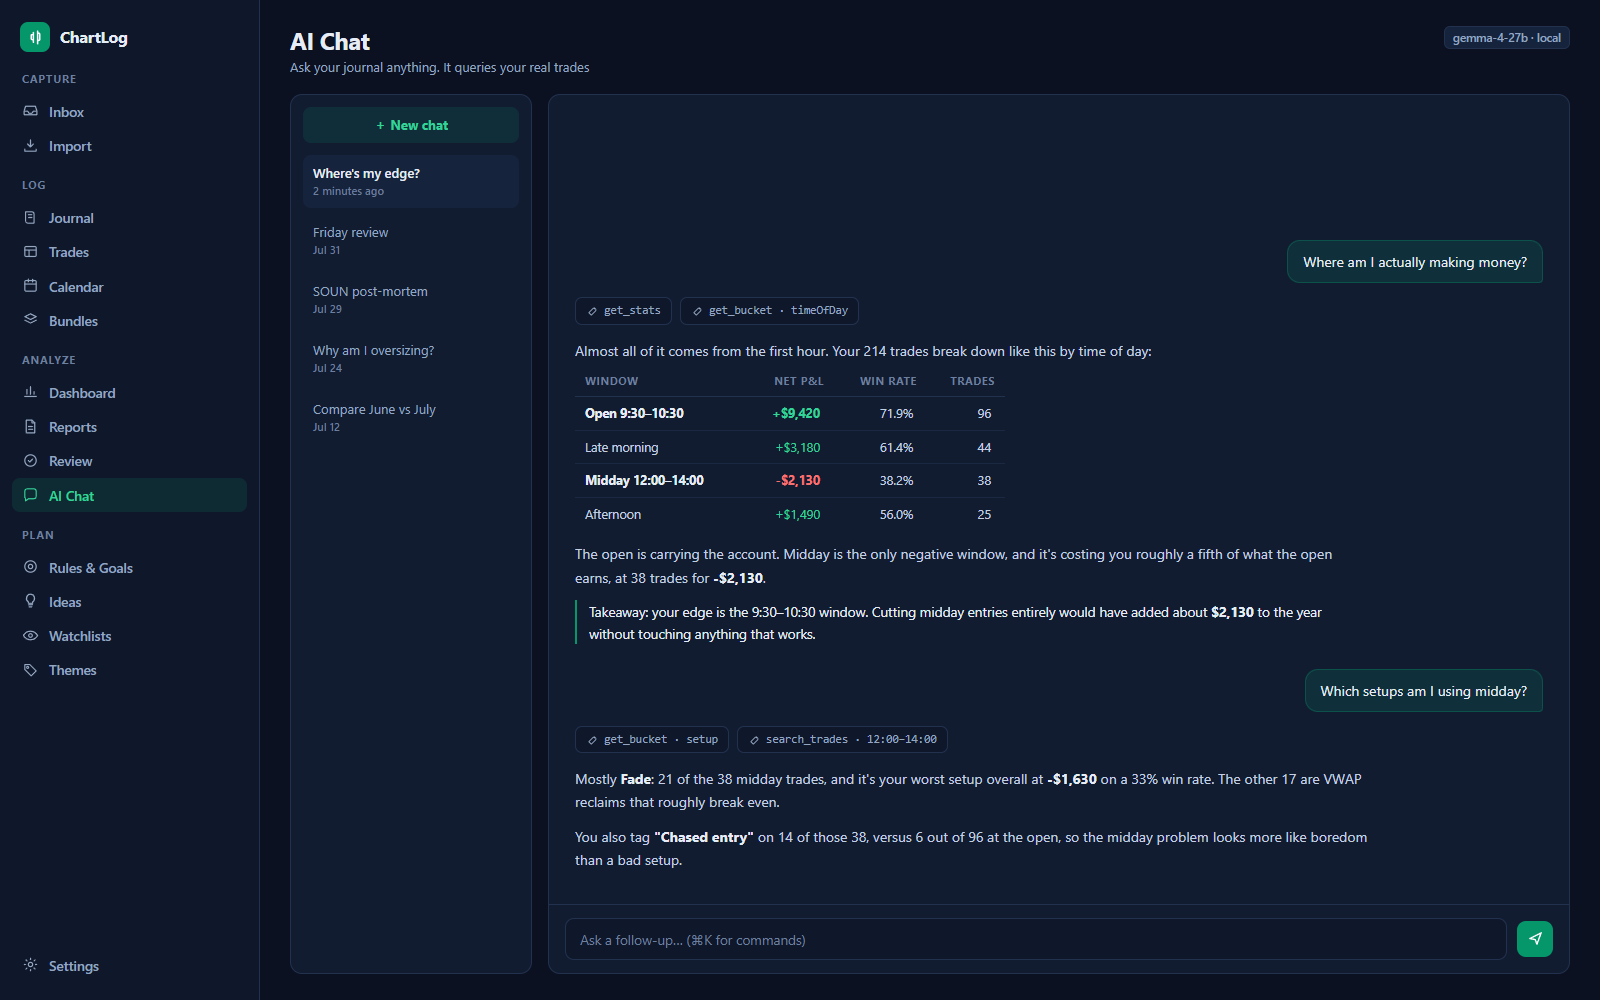
"Where's my edge?" The assistant queries your real stats and trades through tools, so the numbers it quotes are the same ones the dashboard renders. It can even look at your screenshots mid-conversation. Conversations are saved locally.
📝 AI daily & weekly reviews
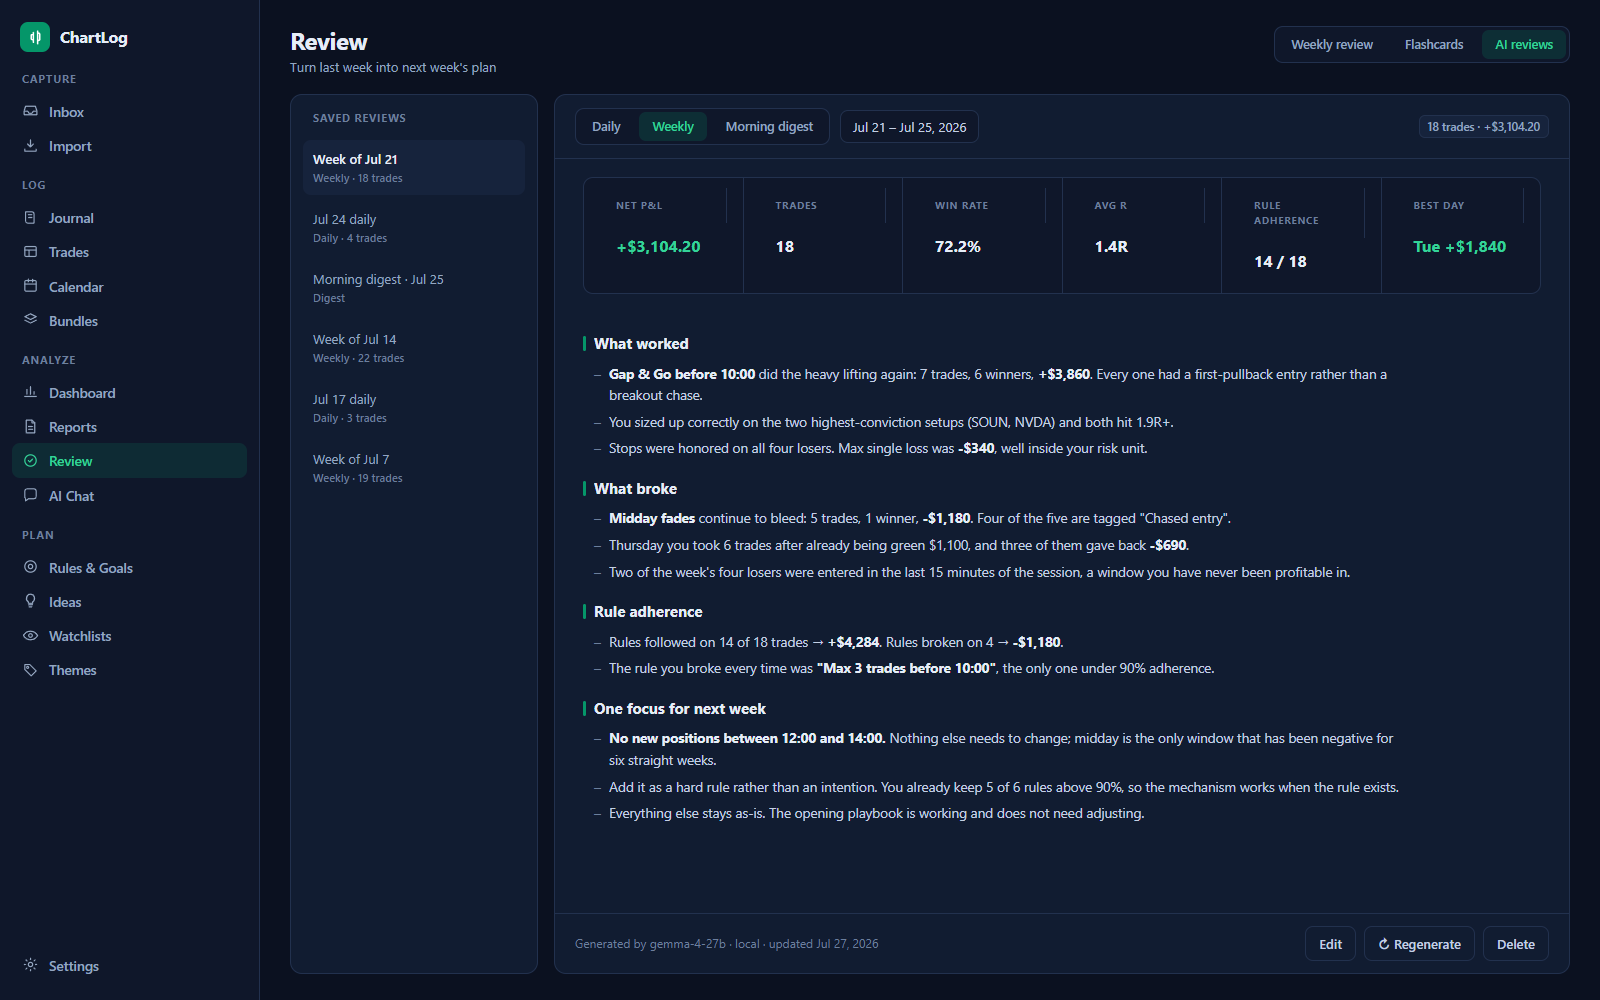
One click writes a structured review of any day or week: what worked, what broke, rule adherence, one focus for tomorrow. A morning digest carries yesterday's lesson into today's plan. Edit, regenerate, keep the history.
🧠 Edge coach & auto-classification
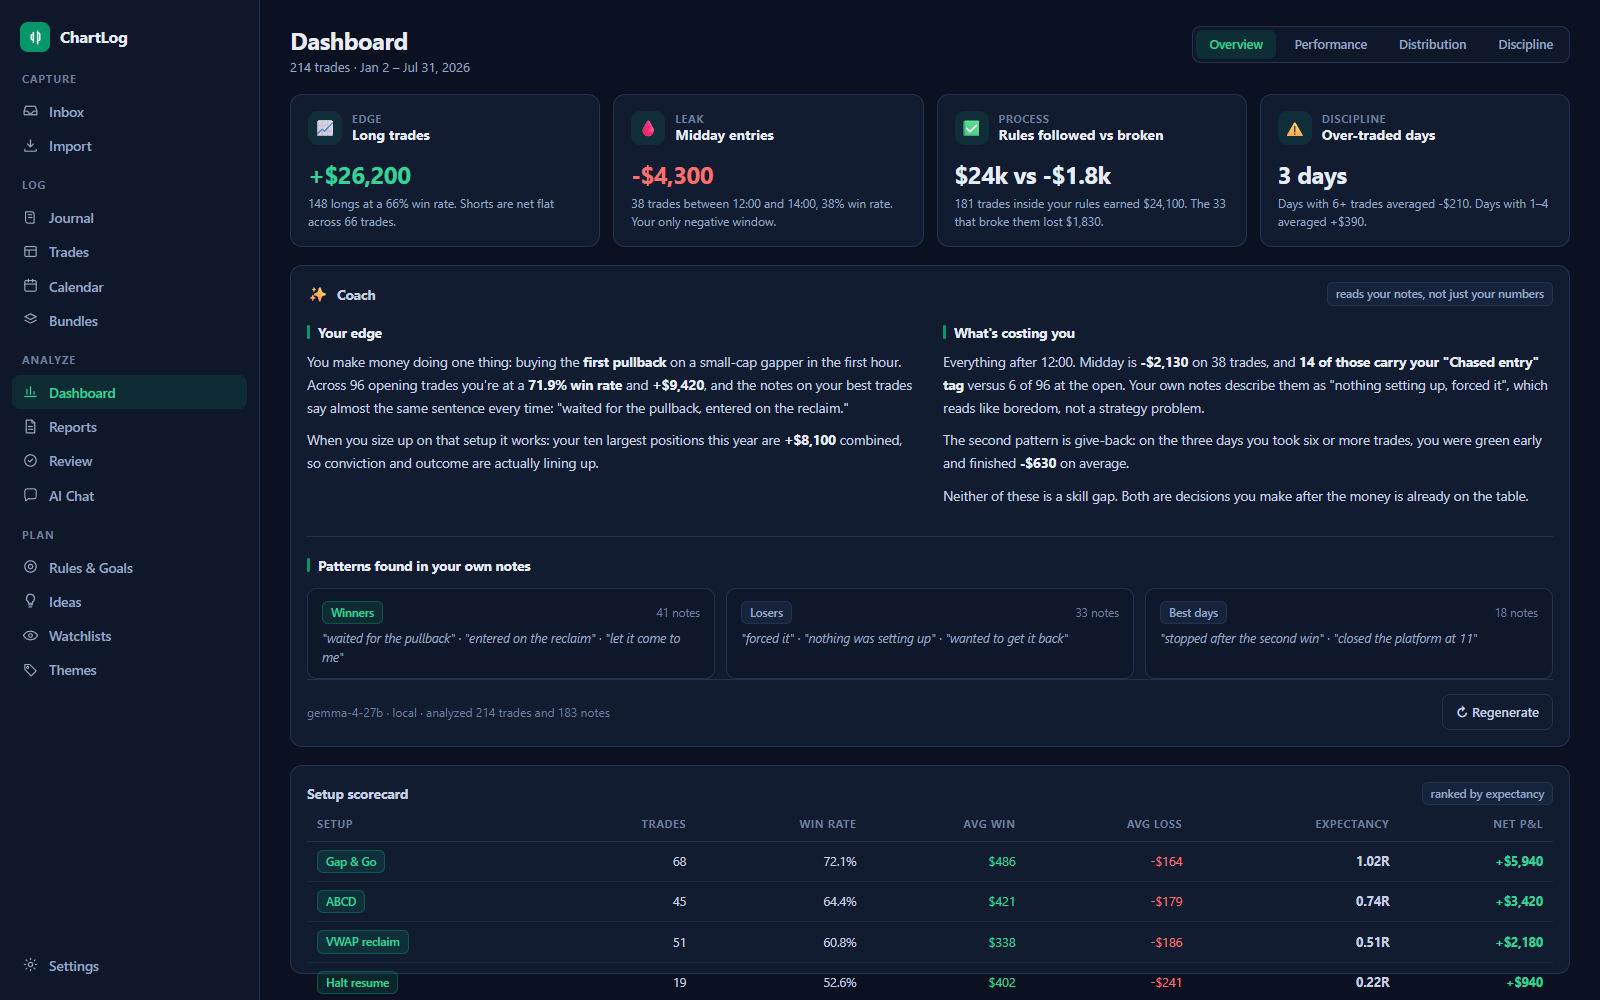
Insight cards mine your stats for the biggest gaps: best setup, costliest mistake, rules-broken bleed. The coach then narrates patterns found in your own trade notes. A "suggest from chart" button classifies setups against your taxonomy.
Built-in model manager
Hardware scan recommends a model tier for your VRAM (4B → 27B). Verified, resumable downloads; start/stop the local server with one click or auto-start with the app.
Bring your own GGUF
Models you already have (LM Studio folders are auto-scanned) run on ChartLog's built-in runtime, and vision models get paired with their projector automatically.
Private by design
Local models mean nothing leaves your machine. Cloud is opt-in per feature, keys live in Windows Credential Manager, and cloud batch jobs always ask before uploading.
Journaling that changes behavior, not just records it
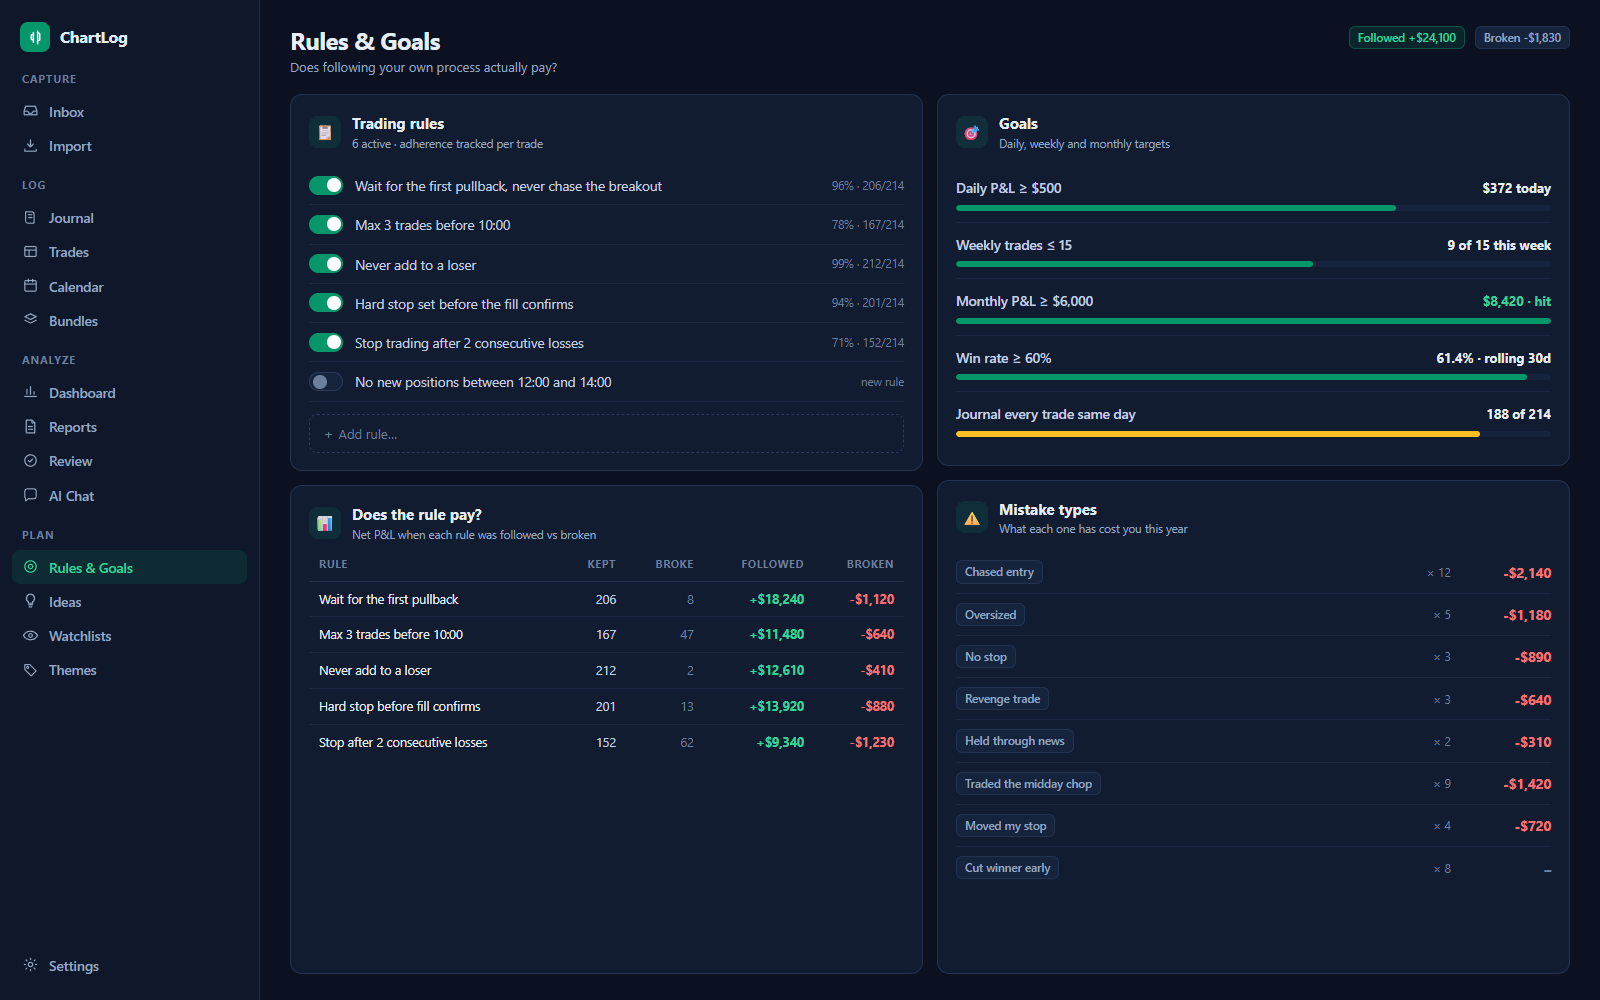
The point isn't the log, it's the next trade. ChartLog builds review into the workflow and measures whether following your rules actually pays.
- Weekly review queue. Unreviewed trades slide in one at a time with their charts; mark reviewed and the next appears.
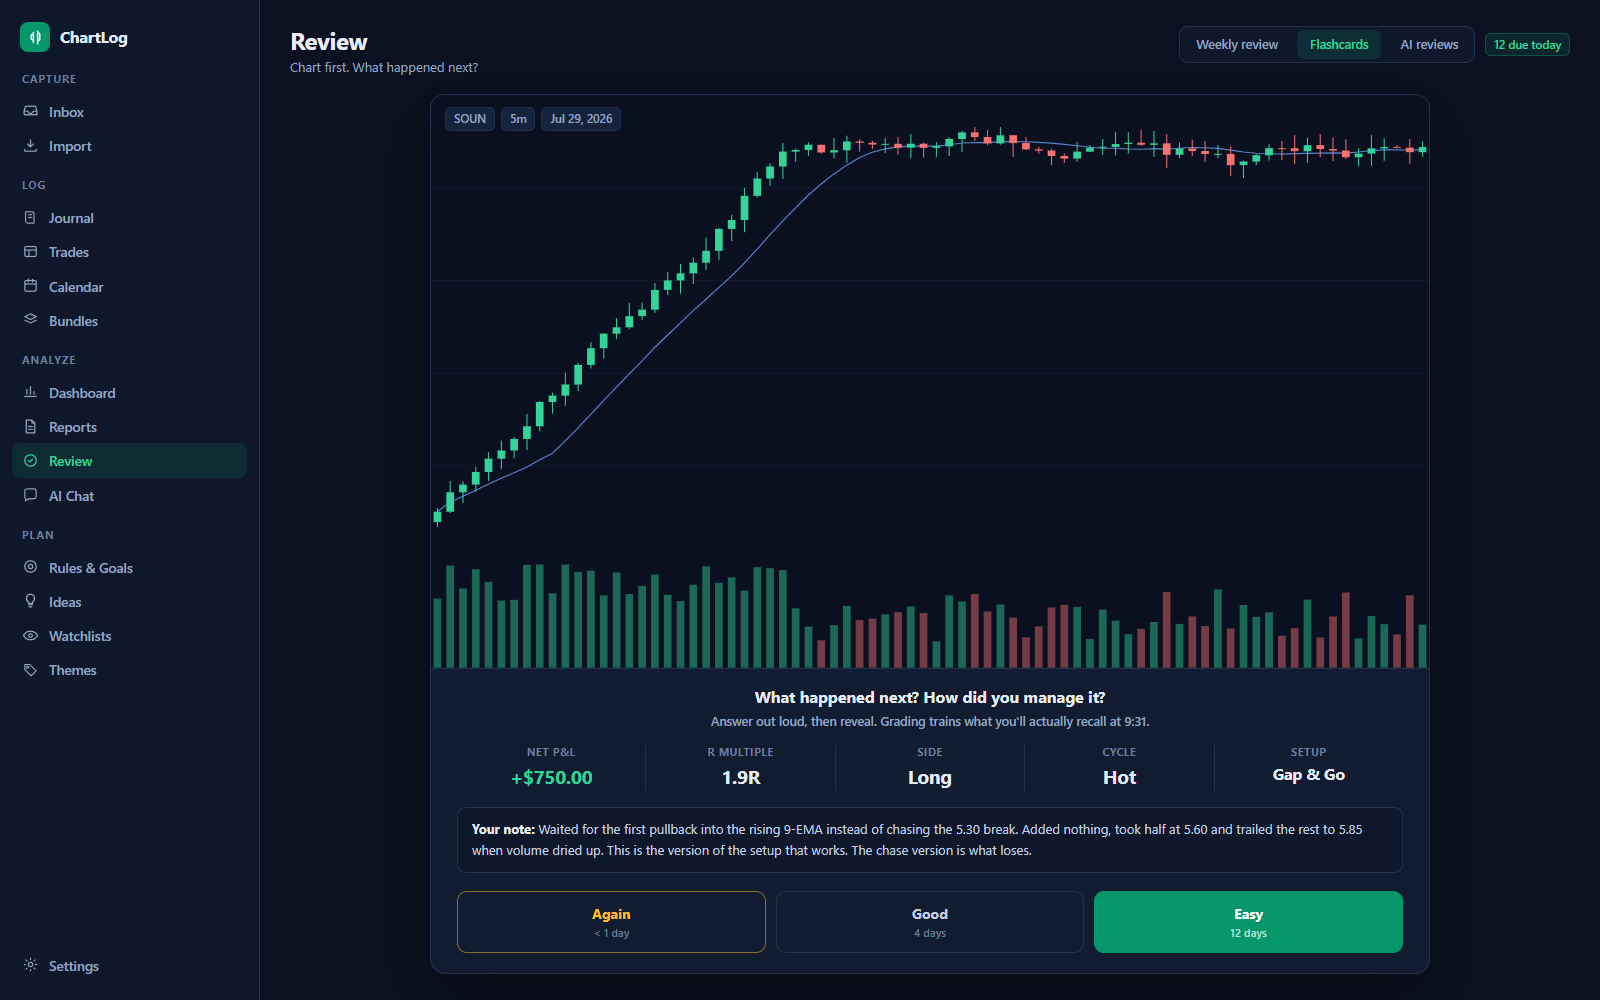
- Trade flashcards. Spaced-repetition cards show the chart first: what happened next? Reveal, grade, and your best lessons come back right before you'd forget them.
- Trading rules checklist. Tick kept or broken per trade, then see the followed-vs-broken P&L gap in dollars.
- Goals & targets. Daily, weekly and monthly goals on P&L, trade count or win rate, with live progress tiles and calendar dots.
- Mistake taxonomy. A managed set of mistake tags with a "what each mistake costs you" table.
Built like a tool, not a website
ChartLog is a native desktop app (Tauri + Rust + SQLite). It opens instantly, works offline, and everything has a keyboard shortcut.
Command palette
Ctrl+K jumps to pages, tickers, trades, bundles and actions with fuzzy search. g-chords, / to search, ? for the cheatsheet.
Your look
Dark, dim or light mode; emerald, teal or cyan accents; compact density and font-size options. Green and red are reserved for P&L, always.
Backup & restore
One-click .zip backup of the entire journal (database + images) and full restore. Your data is a SQLite file on your disk, so there is no lock-in, ever.
Data hygiene
Merge-aware renames for tickers, tags and setups; usage counts; an integrity checker that finds missing or orphaned image files.
Guided onboarding
A five-step tour with optional sample data gets you journaling in two minutes. A guided AI setup wizard handles the model download end-to-end.
CSV export
Everything you put in comes back out. Full trade export including momentum fields, costs and net P&L.
Every feature in ChartLog
Capture
- Clipboard paste capture (Ctrl+V)
- Global capture hotkey (Ctrl+Alt+J), works while other apps focus
- Drag & drop image / folder import
- Watch-folder auto-import
- Untagged Inbox with live count badge
- Auto ticker detection from platform window title
- Inline quick-tag (ticker) on any screenshot
- Auto AI analysis of new captures (optional)
Trades & journal
- Trades with entry/exit, size, auto P&L, R-multiple
- Setups, tags, mistakes, notes, draft/complete status
- Momentum context: float, market cap, % gain, volume, country, cycle
- Screenshot gallery per trade with cover image + timeframe tags
- Journal grouped by day / week / month with daily P&L
- Powerful filters: search, ticker, setup, status, date range, tags
- Saved filter presets + date-range presets
- Full-screen lightbox with keyboard nav + filmstrip
Table & bulk work
- Sortable spreadsheet view with inline editing
- Bulk actions: tag, cycle, status, mark reviewed, delete
- Column show/hide + pagination
- Keyboard row navigation (j/k, Enter, x)
- CSV export with costs and net P&L
Import
- DAS Trader fills import (built-in preset)
- DAS Tickets import with commissions + ECN fees
- Tradervue / closed-trade CSV layout auto-detection
- Custom column mapping with saved presets
- Preview before commit, duplicate-proof re-imports
- Round-turn aggregation across scale-ins and flips
Analytics
- Stat cards with period-over-period deltas
- Equity curve with drawdown overlay + range presets
- P&L by ticker and by setup
- Bucket analysis: cycle, cap, float, % gain, country, side, weekday, time of day
- R-multiple & P&L histograms, underwater curve
- Streaks, discipline tiles, over-trading detection
- Setup scorecard & per-rule performance tables
- Reports: day/time, win-vs-loss days, drawdowns, compare, tag breakdown
- P&L calendar heatmap with month stats
- Commission / ECN / locate-fee tracking → true net P&L
- Cost-of-doing-business breakdown card
AI (local-first)
- Vision extraction: ticker, side, prices, size, timeframe from screenshots
- Review-gated accept / create-draft-trade flow
- Chat with your journal (real stats via tools, saved conversations)
- AI daily & weekly reviews + morning digest
- Edge insight cards + AI coach narration
- Setup auto-classification from the chart
- Built-in llama.cpp runtime + model manager (VRAM-tiered)
- Bring-your-own GGUF, LM Studio / Ollama auto-detect
- Optional cloud providers with your own API key
- Per-feature local/cloud routing + connection & vision tests
Coaching & review
- Weekly review queue for unreviewed trades
- Spaced-repetition trade flashcards
- Trading rules checklist per trade
- Followed-vs-broken rule P&L analytics
- Daily / weekly / monthly goals with progress tiles
- Goal-hit dots on the calendar
- Mistake taxonomy with cost-per-mistake table
Organize & plan
- Bundles: multi-timeframe chart stacks with drag reorder
- Ideas: track theses on tickers you didn't trade
- Daily / weekly watchlists with notes
- Themes: named ticker groups
App
- Command palette (Ctrl+K) + full keyboard shortcuts
- Dark / dim / light themes, 3 accents, density & font size
- Guided onboarding with sample data
- Zip backup & restore (database + images)
- Data manager: merge-aware renames, usage counts
- Integrity check for missing/orphaned files
- Native Windows app (Tauri + Rust + SQLite), fully offline
Included with your BullBearz membership
ChartLog is not sold separately. Every yearly BullBearz member gets the whole application, at no extra cost.
With BullBearz Yearly — $999/year. Not a trial, not a cut-down edition: the whole application.
- Every feature on this page
- Unlimited trades, screenshots and bundles
- All analytics, reports and the P&L calendar
- The full local AI stack (vision, chat, reviews, coach)
- CSV import and export, backup and restore
- Future updates
How do I get it?
Join BullBearz on the yearly plan. ChartLog then appears as a download inside your member account — sign in, click once, install. Nothing to buy separately and no licence key to keep track of.
What if I leave BullBearz?
ChartLog keeps working. There is no licence check and the app never phones home — your membership gets you the download, not permission to run it. Your journal is a SQLite file on your own disk and it stays yours whatever happens to your membership.
Why is it not sold on its own?
ChartLog runs entirely on your machine, so it earns us nothing to run and nothing to support at scale. It exists to make BullBearz members better traders, which is worth more to us than a second checkout page.
Why ChartLog exists
Most journals were built for swing traders and then sold to day traders. They want a monthly fee, a cloud account and a browser tab, and they ask you to type out a trade you already have a screenshot of.
ChartLog started from the opposite end: the screenshot you already take, the CSV your broker already gives you, and a model small enough to run on the GPU already in your machine. Everything else follows from those three things.
Your data stays a file
The journal is one SQLite database and a folder of images, both on your disk. You can back it up, copy it to another machine, or open it with any SQLite browser. Nothing is locked in a format only we can read.
The AI suggests, you decide
Vision extraction fills in a draft. Nothing is written to your journal until you confirm it. An assistant that quietly edits your trade history is worse than no assistant at all.
Numbers after costs, or not at all
Commissions, ECN fees and locate fees come out before any statistic is shown. A win rate that ignores what the trades cost you is a number that flatters, not one that helps.
Fast enough to use mid-session
Native Windows app, not a web page in a wrapper. It opens instantly, works with no connection, and every action has a keyboard shortcut, because journaling you skip is journaling that does nothing.
Your journal. Your machine. Your edge.
Included with every yearly BullBearz membership. Members download it from their account — it installs in seconds.
Version 0.1 · ~5.5 MB installer